
-
Getting Started
-
Background1 Topic
-
Introduction to Propensity Scores2 Topics2 Quizzes
-
Estimating and Assessing the Propensity Score4 Topics
-
Applying the Propensity Score5 Topics
-
High-Dimensional Propensity Scores2 Topics
-
Applying the High-Dimensional Propensity Score3 Topics
-
References
-
Additional Resources

PS distributions in the exposed and unexposed groups
After we estimate the propensity score and use one of the described propensity score methods described in section 1, it’s recommended that we compare the propensity score distribution within each exposure group using a histogram or side-by-side box-plots before and after applying the propensity score method. Before a propensity score method (e.g., matching) was used, it’s expected that the propensity score distribution is imbalanced between the two exposure groups; those treated will have higher propensity score in general and those untreated will have smaller propensity score. After using the propensity score method to balance the exposure groups, areas of overlap in the propensity score distribution will be identified, so that we will have a more uniform propensity score distribution.
Standardized differences to test PS
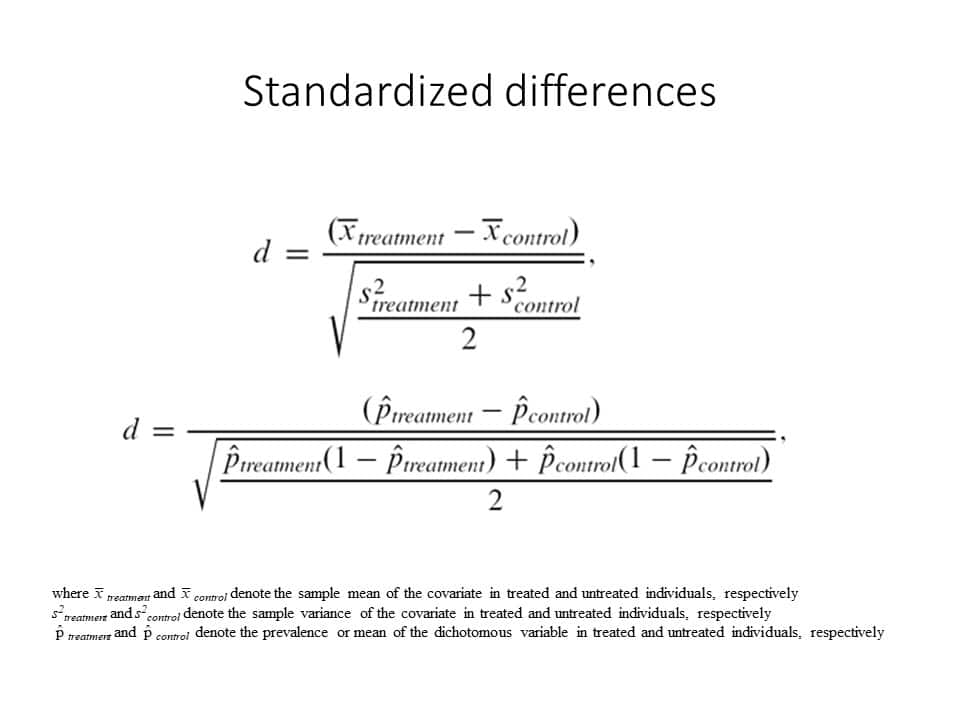
Another recommended way to test the performance of the propensity score is to compare the proportions/means of baseline characteristics across the two treatment/exposure groups. You can check the balance of these characteristics by eyeballing them before and after using a propensity score method. However, there is an objective measure to identify which variables are balanced and which aren’t called the standardized difference. It measures the difference in proportions or means expressed in standard deviation units, so it’s independent of sample size, which is why it is recommended for comparing baseline covariates when using propensity scores. There is a general consensus that a standardized difference of <10% indicates a good balance. More information can be found in the following article 1.
Standardized differences equation
Distributions of covariates before and after matching
The standardized difference compares only the mean or proportion of a baseline characteristic. Additionally, we can compare the entire distribution of the baseline characteristics before and after applying a propensity score method, for example using side-by-side boxplots or cumulative distribution functions.
Exercise 3 – PS diagnostics
Refer to Figure 2 in the following article6. Based on the standardized differences of the baseline characteristics, list the characteristics that were imbalanced before and after applying IPTW.
In Utero Antidepressants and Neurodevelopmental Outcomes in Kindergarteners
Singal, Chateau, Struck, et al.